Mapping the energy tech/software landscape

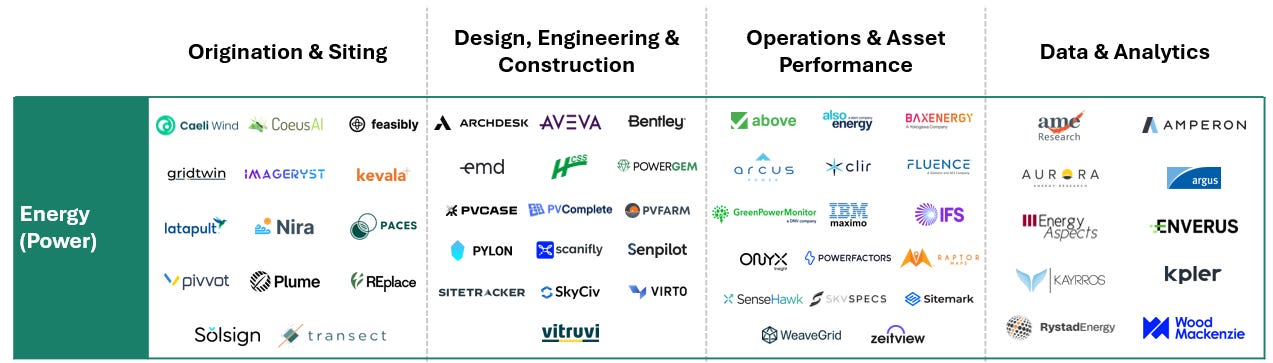
The energy transition is, at its core, an enormous construction and operations problem. Trillions of dollars of new generation, storage and transmission infrastructure have to be sited, financed, built and then run for decades, and the pace at which that happens increasingly depends on software. As the volume of projects has grown and the assets themselves have become more distributed and data-rich, a distinct category of energy-specific software has emerged to manage each stage of the work. The market map above is one way to make sense of it.
It sorts the sector into four categories that follow the lifecycle of a power asset, from finding a site to running it after it is built: origination and siting, design and construction, operations and asset performance, and data and analytics. Together they span dozens of companies, each occupying a different stage of how energy infrastructure gets developed, operated and understood.
Origination and siting is the earliest stage, covering where a project gets built. These tools identify and evaluate potential sites using land, grid, environmental and permitting data, then assess interconnection feasibility and development risk. Companies here include Caeli Wind, Transect and Paces. The work is mostly about screening large amounts of geospatial and regulatory data to decide whether a site is worth pursuing, well before any capital is committed. Getting this stage wrong is expensive, since a poorly sited project can stall for years in interconnection queues or permitting.
Once a site is chosen, design, engineering and construction tools handle the build-out. They cover system design and layout, simulation, procurement, and project and field management during construction. AVEVA, PVComplete and Sitetracker sit here. The category turns a site into a buildable, financeable project and then manages the physical construction process, coordinating the engineering drawings, equipment orders and field crews that bring an asset online.
After a project is energized, operations and asset performance tools run it. They monitor output, detect faults and underperformance, schedule maintenance, and coordinate inspections, increasingly with drones and robotics. The goal is to keep an asset producing at its rated capacity and to minimize lost generation over a lifespan that can stretch decades. Raptor Maps, PowerFactors and Gridware operate here. Raptor Maps, a Maverix portfolio company, builds lifecycle management software for utility-scale solar, and its 2026 Global Solar Report illustrates what is at stake in this category: average power loss across US solar runs above 5%, while sites using autonomous drone inspections average closer to 3%. Across a large fleet, that two-point difference represents meaningful recovered generation, which is the difference between a project hitting its return assumptions and missing them.
Data and analytics sits across the other three. Rather than running a specific asset, these tools provide market intelligence, pricing, forecasting and benchmarking to operators, asset managers, financiers and insurers, informing decisions about the broader market. Enverus, Wood Mackenzie and Argus are some of the established names here. Where the first three categories help a single project get built and run, this layer helps the people funding and trading around those projects understand the market they sit in.
What the four categories share is that each one turns a slow, manual, capital-intensive process into something faster and more measurable. Siting that once took months of manual research compresses into a data query. Construction that ran on spreadsheets and email runs on a shared project record. Assets that were checked by hand a few times a year are monitored continuously. In every case, the software is not replacing the physical infrastructure; it is making the infrastructure cheaper to develop and more productive to operate, which is exactly what a transition measured in trillions of dollars requires.
That also makes the sector somewhat resilient to the swings in sentiment that hit clean energy more broadly. Demand for these tools is tied less to any single policy or subsidy and more to the simple fact that a growing base of energy assets has to be planned, built and operated regardless of who owns them or why. The map is worth keeping close because it is a useful frame for any company you come across in the space: knowing which category a business sits in tells you a great deal about who it sells to, what it competes on, and where the value actually accrues.